Sample Chart Report 2
If you select the Status as a chart category, and # of Issues as values to be shown on the chart, and click on the 3D Pie chart button to specify the chart type and activate the Data Table and Legend options in the View window, the following chart report will appear (Figure: Sample Chart Report 2):
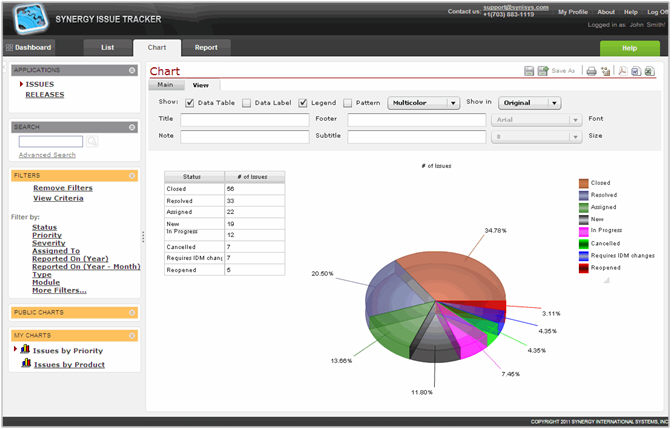 |
Figure: Sample Chart Report 2 |